CRO & Experimentation
Top 15 Metrics to Optimize Conversion Rate Optimization
Track the top metrics to help you analyze conversion rate optimization and improve your CRO strategy. Learn how to measure key metrics for improved conversions.

Sakshi Gupta


Are you missing out on potential sales from your website visitors? According to the Census Bureau of the Department of Commerce, total retail sales for the second quarter of 2025 reached $1,865.4 billion, a slight increase of 0.4%. This shows there's growth in the market, but many businesses still struggle to convert visitors into paying customers.
Tracking the right metrics to help you analyze conversion rate optimization is key to capturing a larger share of that growth. By understanding the factors driving conversions, you can optimize every step of the customer journey. Let's start with Conversion Rate (CVR), the cornerstone metric for any CRO strategy.
Key Takeaways
Conversion Rate (CVR) measures the percentage of visitors who complete a desired action, directly impacting revenue.
Click-Through Rate (CTR) tracks how effectively ads and CTAs drive engagement.
Bounce Rate indicates the relevance and user experience of your landing pages.
Average Order Value (AOV) measures revenue per order and helps increase profitability without extra traffic.
Cart Abandonment Rate highlights friction points in the checkout process that need optimization.
Monitoring and optimizing these metrics enables businesses to improve CRO and increase conversions.
1. Conversion Rate (CVR)
Conversion rate measures the percentage of visitors who complete a desired action, such as making a purchase or signing up for a newsletter. It's a critical metric because it directly reflects how effectively your website turns visitors into customers, impacting your overall revenue.
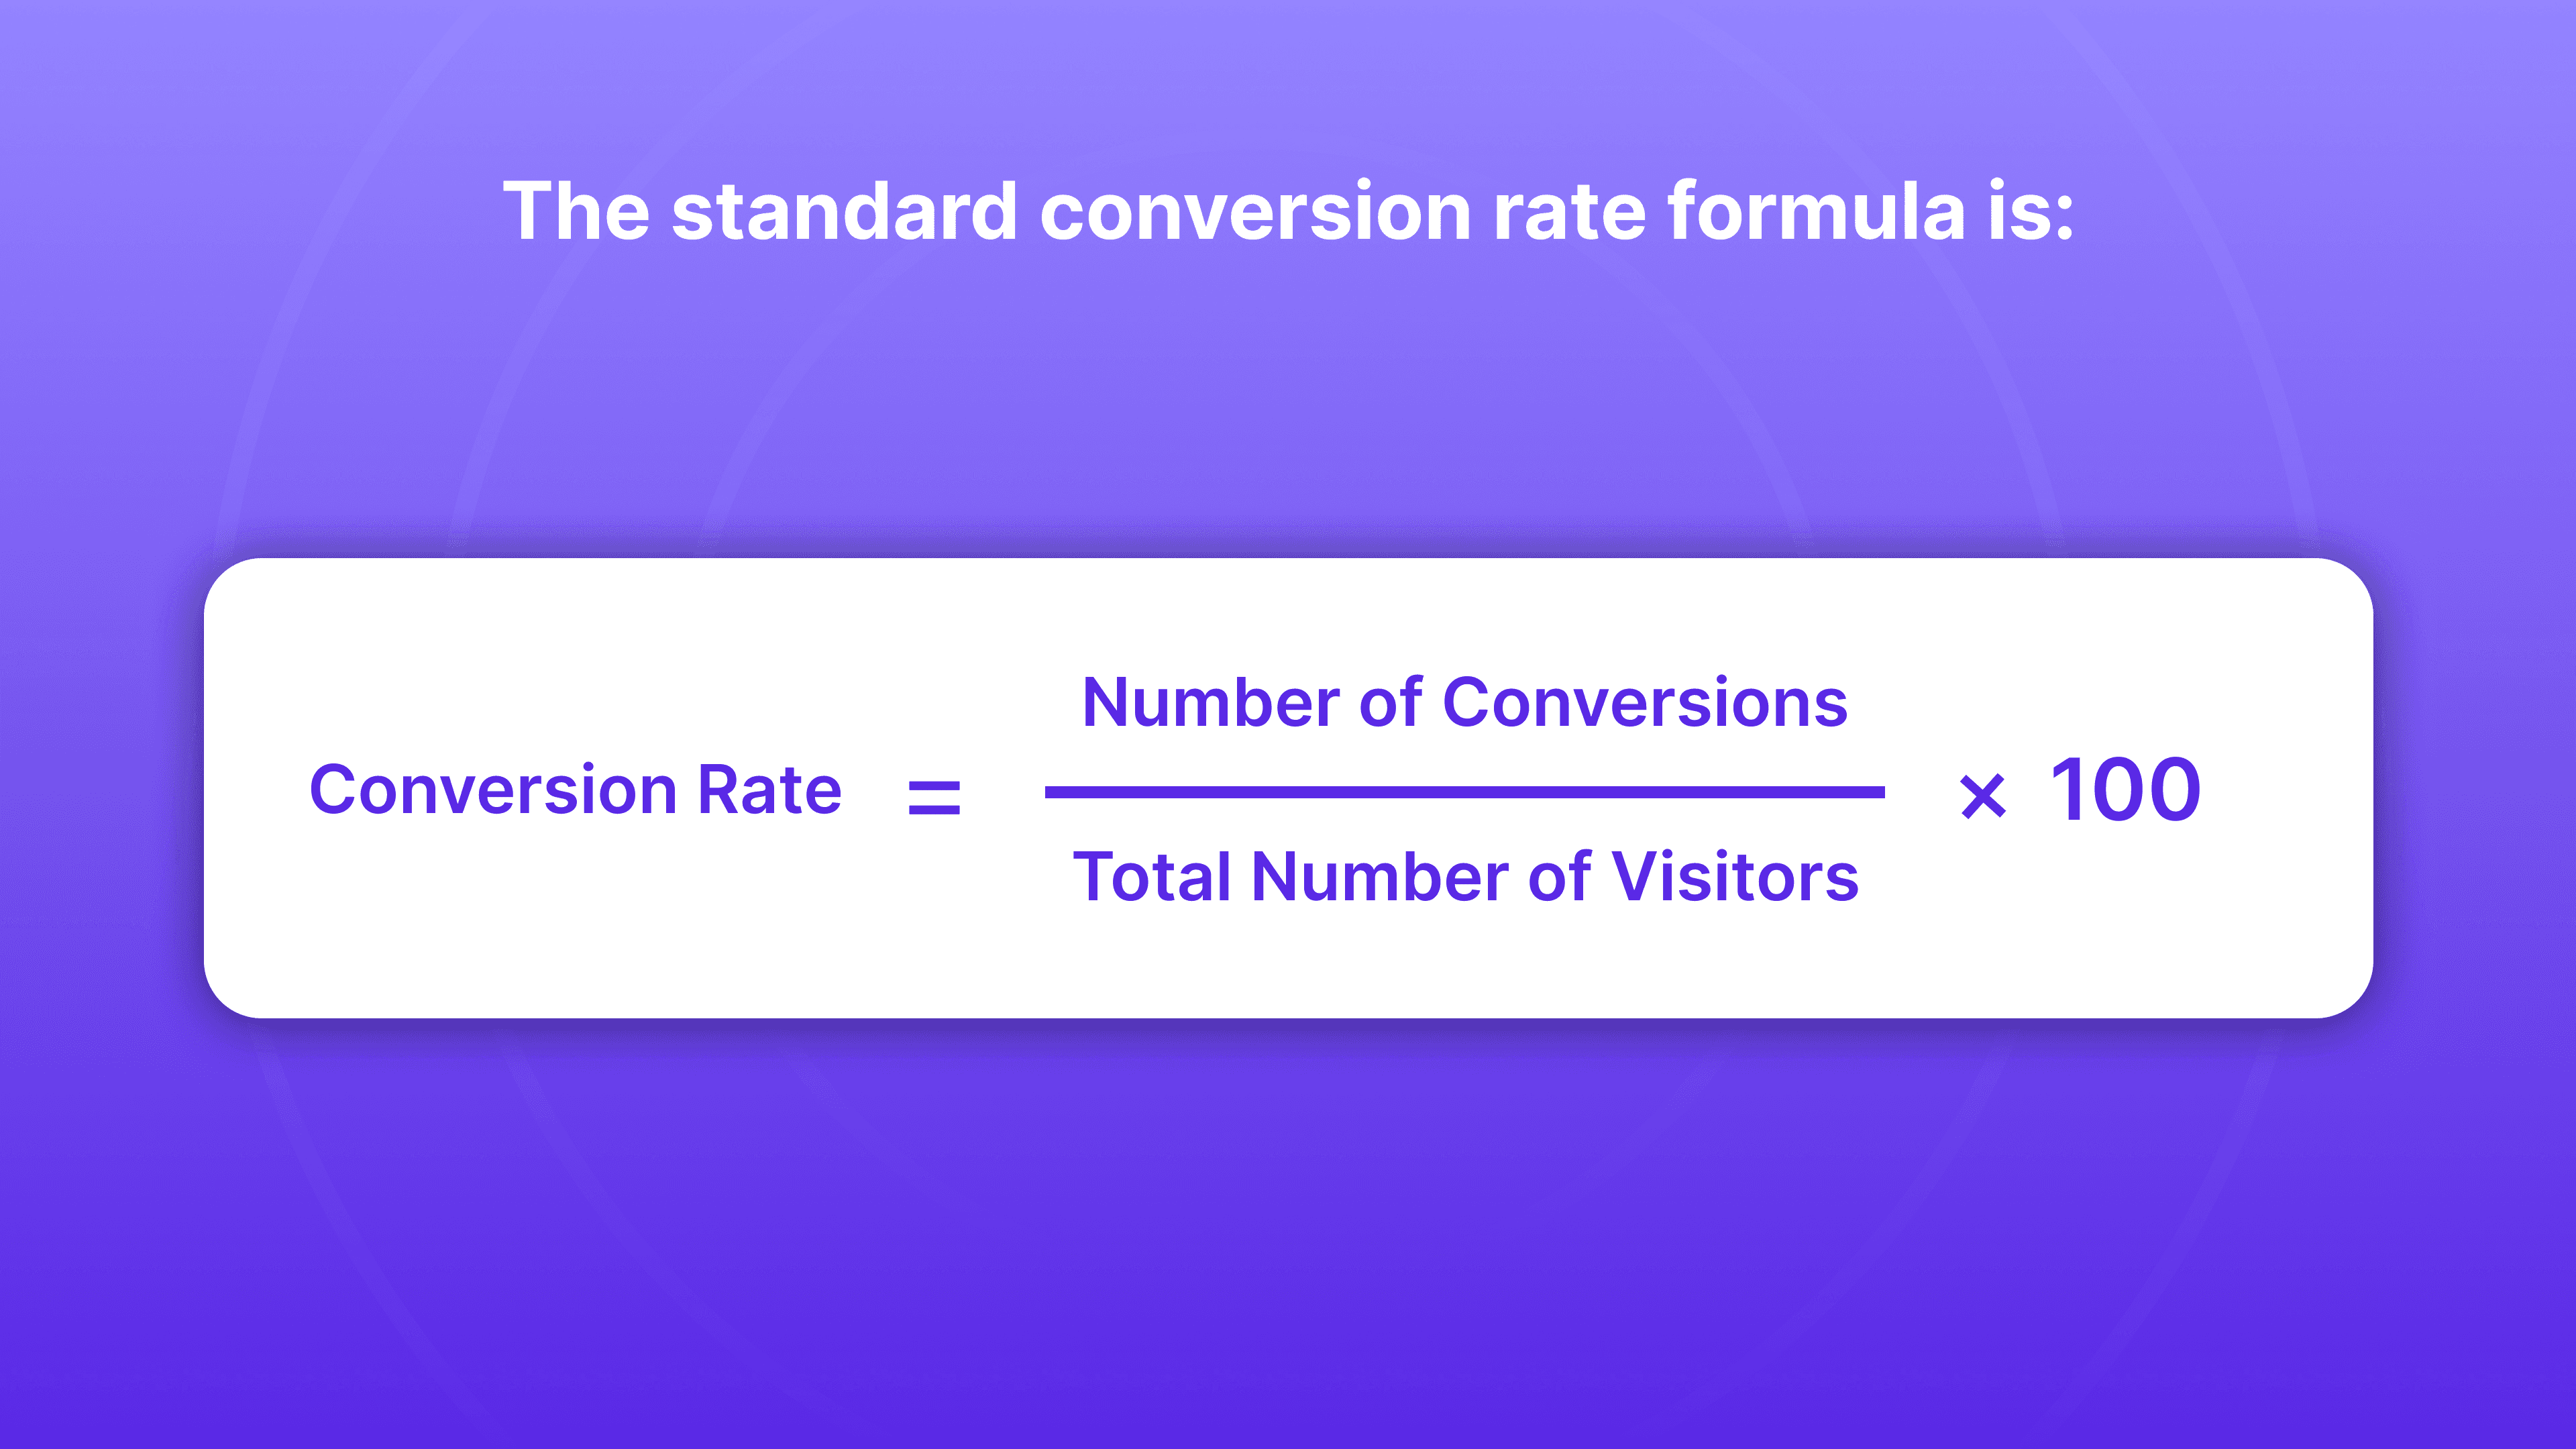
Formula:
(CVR) = (Conversions ÷ Total Visitors) × 100
Example Calculation:
If you had 500 conversions and 10,000 visitors, your conversion rate would be:
(500 ÷ 10,000) × 100 = 5%
Pro Tip: If your conversion rate is lower than expected, consider improving your landing page design, simplifying the checkout process, or running A/B tests on your calls-to-action (CTAs). A simple change in button color or placement can lead to major improvements in conversions.
2. Click-Through Rate (CTR)
Click-through rate measures the percentage of people who click on a link, ad, or call-to-action (CTA) compared to the total number of people who view it. CTR is crucial because it helps you assess how effectively your content or advertisements are driving engagement and prompting action from your audience.
Formula:
CTR = (Clicks ÷ Impressions) × 100
Example Calculation:
If your ad received 200 clicks and 10,000 impressions, your CTR would be:
(200 ÷ 10,000) × 100 = 2%
For Example:
Struggling to increase your CTR? Nudge can help by personalizing your landing pages and CTAs in real-time. With its AI-driven platform, Nudge ensures that your ads and content are personalized to the user's behavior, increasing engagement and click-through rates.

3. Bounce Rate
Bounce rate measures the percentage of visitors who leave your website after viewing only one page. It's a crucial metric because a high bounce rate suggests that your landing page or content isn't engaging enough.
This lack of engagement can cause visitors to leave without exploring further, which may indicate issues with your site's user experience or relevance.
Formula:
Bounce Rate = (Single-Page Sessions ÷ Total Sessions) × 100
Example Calculation:
If you had 1,000 visitors, and 600 of them left after viewing only one page, your bounce rate would be:
(600 ÷ 1,000) × 100 = 60%
Reducing your bounce rate can greatly improve overall engagement and conversions.
4. Average Time on Page
Average time on page measures how long visitors stay on a specific page before navigating away. It's an important metric because it indicates how engaging and relevant your content is. The longer visitors stay, the more likely they are to find value and proceed to the next step in their journey.
Formula:
Average Time on Page = Total Time Spent on Page ÷ Total Page Views
Example Calculation:
If users spent 500 minutes on a page and there were 200 page views, the average time on page would be:
500 ÷ 200 = 2.5 minutes
A higher average time on page often suggests that your content is resonating with your audience. For example, longer engagement on product pages typically means visitors are evaluating products in-depth, increasing the likelihood of making a purchase.
5. Pages per Session
Pages per session tracks the average number of pages viewed during a single visit to your website. This metric is important because it indicates how engaged visitors are with your site. The more pages they view, the more likely they are to be interested in your products or services.
Formula:
Pages per Session = Total Page Views ÷ Total Sessions
Example Calculation:
If your website received 1,000 page views across 500 sessions, the pages per session would be:
1,000 ÷ 500 = 2 pages per session
For Example:
If users view multiple product pages or blog posts, they're likely exploring your offerings, which can increase the chances of conversion. This is a good indicator that your site is guiding users through their journey effectively.
6. Cart Abandonment Rate
Cart abandonment rate measures the percentage of shoppers who add items to their cart but leave without completing the purchase. It's a critical metric for eCommerce businesses because it highlights potential barriers in the checkout process, such as high shipping costs, complicated forms, or a lack of payment options.
Formula:
Cart Abandonment Rate = (Abandoned Carts ÷ Initiated Carts) × 100
Example Calculation:
If 300 out of 1,000 shoppers who added items to their cart abandoned the purchase, the cart abandonment rate would be:
(300 ÷ 1,000) × 100 = 30%
Pro Tip: By offering an exit-intent discount or simplifying the checkout process, you could bring back abandoned shoppers and convert them into customers, thereby increasing your revenue.
7. Funnel Conversion Rate
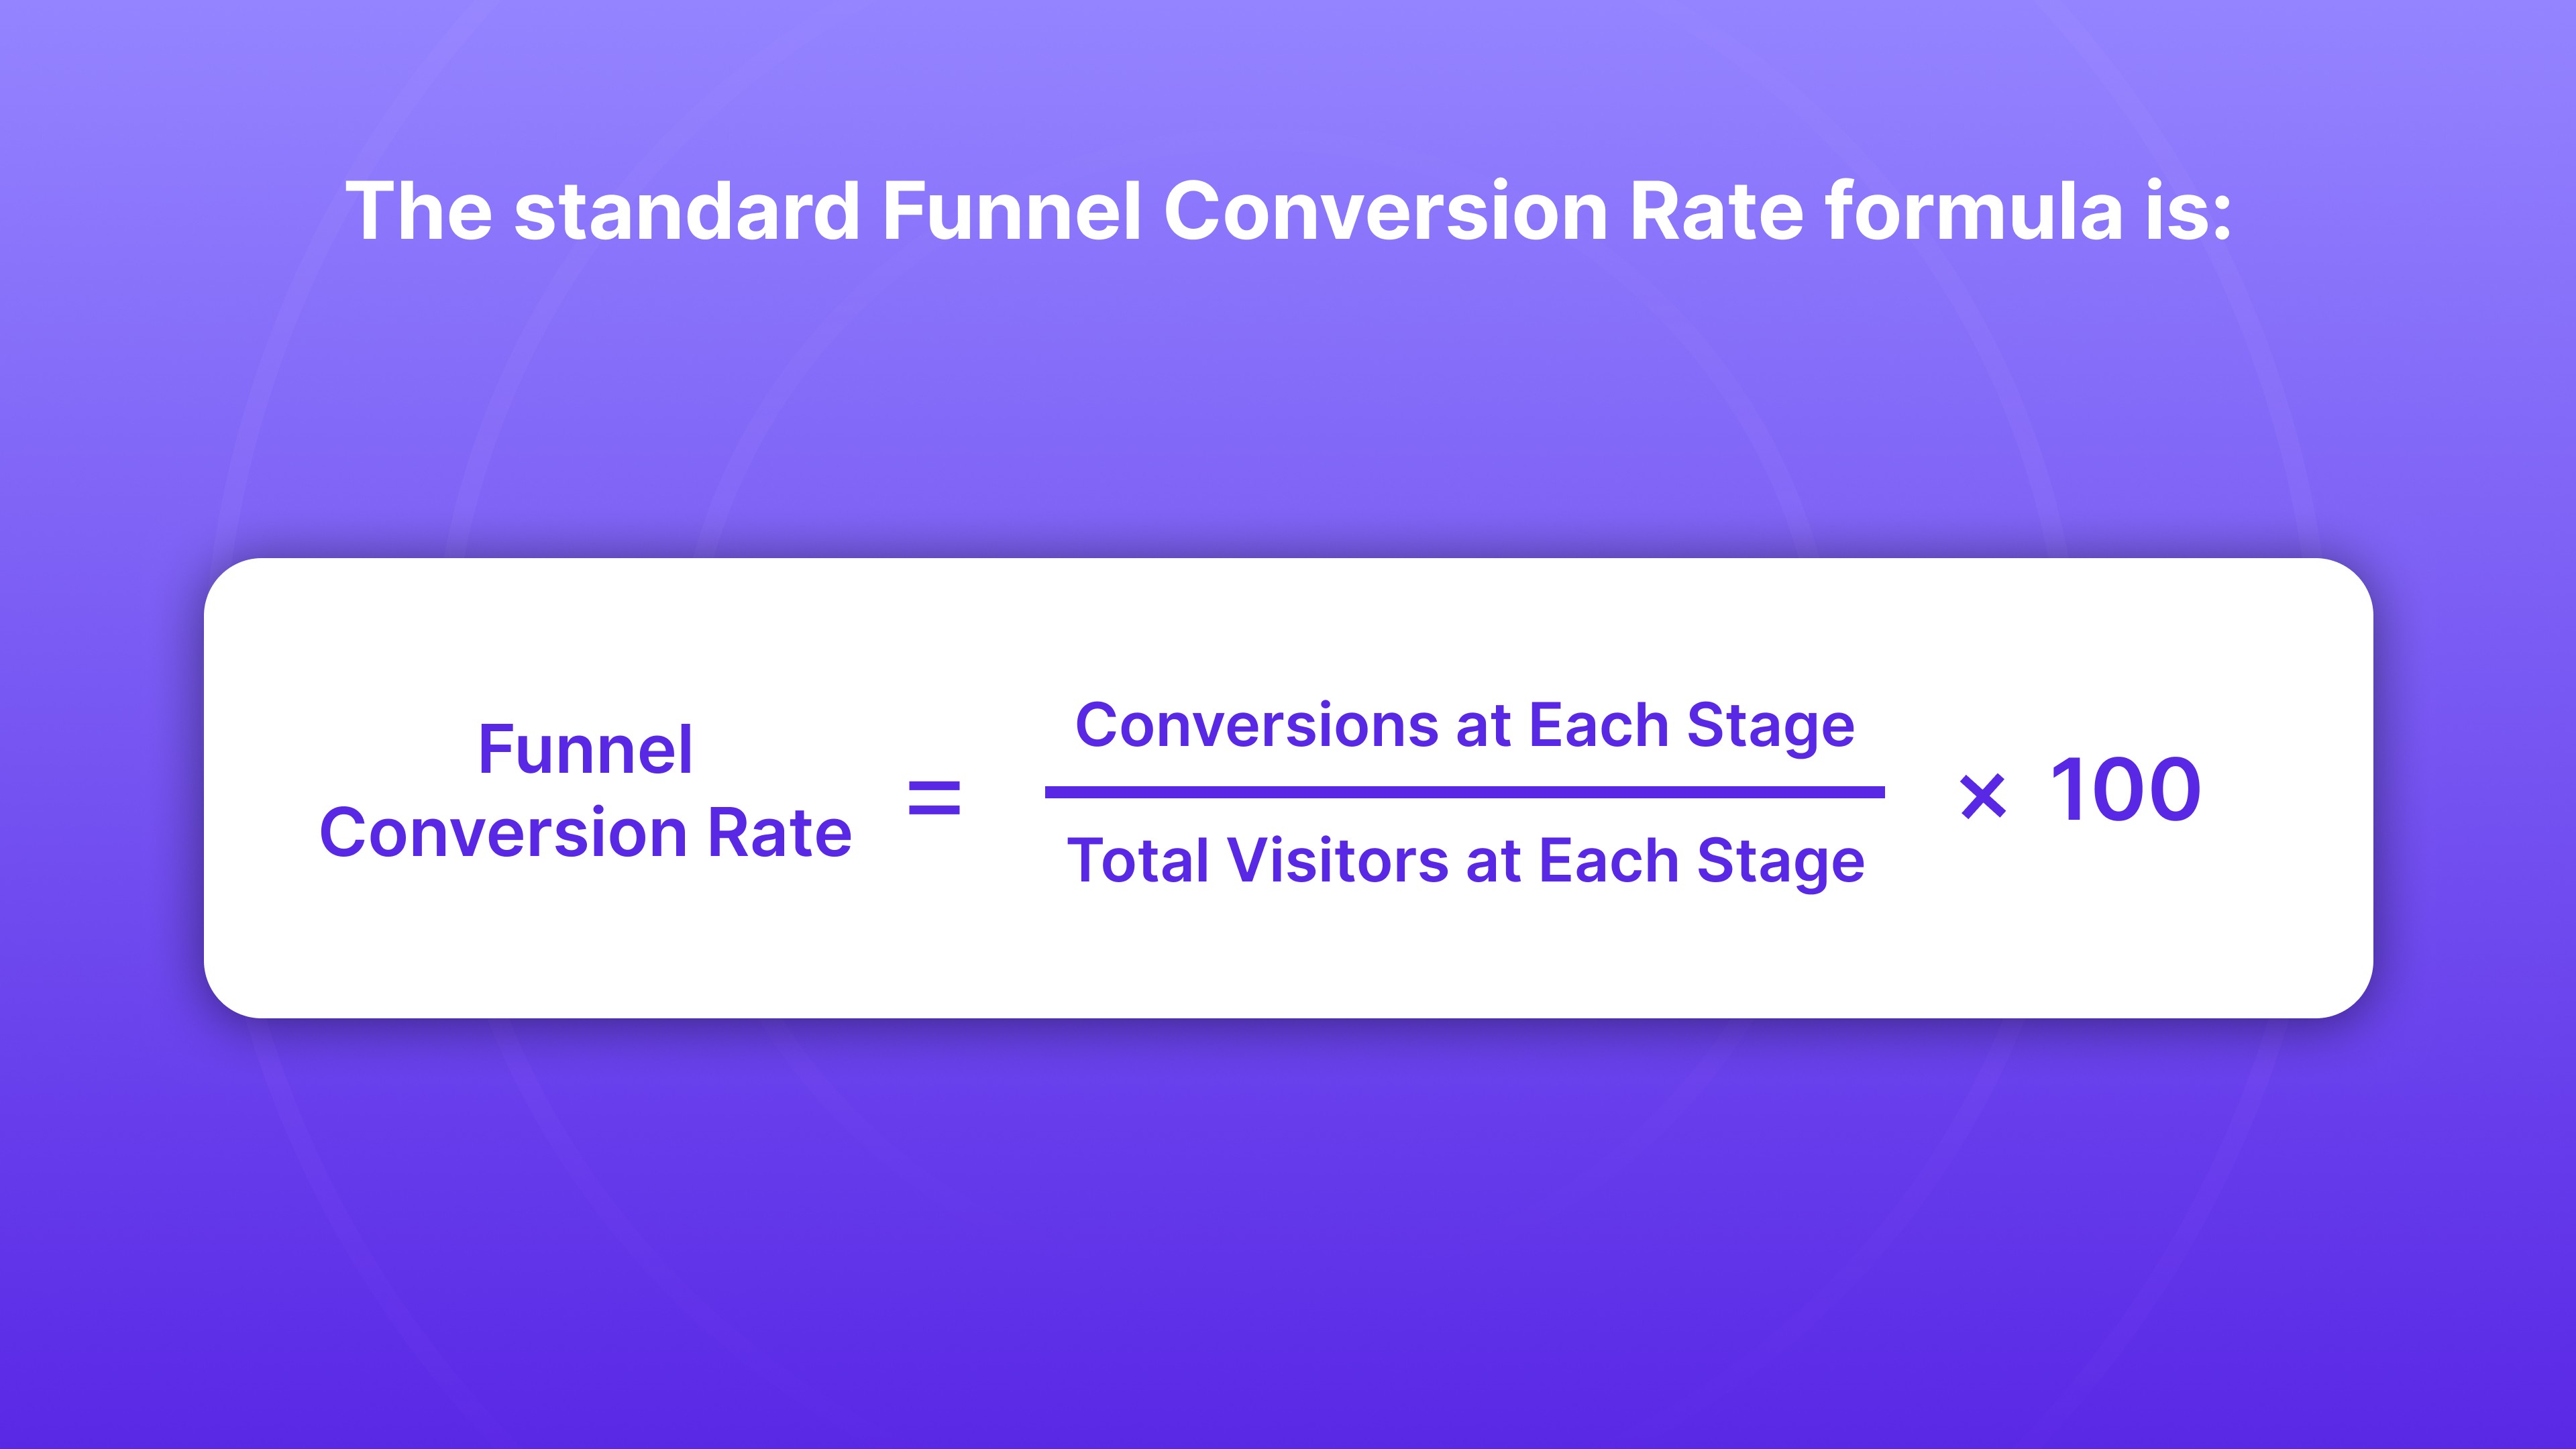
Funnel conversion rate measures the percentage of visitors who progress through each stage of your sales funnel, from awareness to purchase. It's vital for identifying where users drop off in the process and allows you to optimize those stages to improve overall conversions.
Formula:
Funnel Conversion Rate = (Conversions at Each Stage ÷ Total Visitors at Each Stage) × 100
Example Calculation:
If you had 500 visitors reach the checkout stage and 400 completed the purchase, your funnel conversion rate for that stage would be:
(400 ÷ 500) × 100 = 80%
8. Average Order Value (AOV)
Average Order Value measures the average amount spent per order on your website. It's an important metric because increasing AOV allows you to generate more revenue without needing to acquire additional customers, making it a cost-effective way to increase overall sales.
Formula:
AOV = Total Revenue ÷ Number of Orders
Example Calculation:
If your website generated $5,000 in revenue from 200 orders, the AOV would be:
$5,000 ÷ 200 = $25
Want to increase your AOV? Nudge can help by offering personalized product recommendations and upselling opportunities in real-time.

9. Customer Acquisition Cost (CAC)
Customer Acquisition Cost (CAC) measures the total cost of acquiring a new customer, including all marketing and sales expenses. It's a vital metric for assessing the efficiency of your marketing efforts. Lowering CAC means you're spending less to acquire each customer, improving your overall profitability.
Formula:
CAC = Total Marketing & Sales Expenses ÷ Number of New Customers
Example Calculation:
If you spent $2,000 on marketing and sales and acquired 100 new customers, your CAC would be:
$2,000 ÷ 100 = $20 per customer
10. Customer Lifetime Value (CLV)
Customer Lifetime Value (CLV) predicts the total revenue a business can expect from a customer over the entire duration of their relationship. CLV is essential because it helps you understand how much you can afford to spend on acquiring and retaining customers while maintaining profitability.
Formula:
CLV = Average Purchase Value × Purchase Frequency × Customer Lifespan
Example Calculation:
If a customer spends $50 per order, purchases 4 times a year, and remains a customer for 5 years, their CLV would be:
$50 × 4 × 5 = $1,000
For Example:
For a subscription service, increasing CLV by offering personalized recommendations or loyalty programs can greatly increase revenue per customer over time.
11. Return on Ad Spend (ROAS)
Return on Ad Spend (ROAS) measures the revenue generated for each dollar spent on advertising. It's a key metric for evaluating the effectiveness of your paid campaigns. A higher ROAS means your ads are generating more revenue than you're spending, indicating a profitable advertising strategy.
Formula:
ROAS = Revenue from Ads ÷ Ad Spend
Example Calculation:
If you spent $1,000 on ads and generated $5,000 in revenue, your ROAS would be:
$5,000 ÷ $1,000 = 5:1
Example:
If your product ads are performing well with a high ROAS, you can allocate more budget to scale the campaign. On the other hand, a low ROAS might suggest a need to refine your targeting or creative strategies to optimize ad spend.
12. Revenue per Visitor (RPV)
Revenue per Visitor (RPV) measures the amount of revenue generated for each visitor to your site. It's a useful metric for understanding the efficiency of your website in converting visitors into revenue. A higher RPV indicates that your site is successfully monetizing traffic.
Formula:
RPV = Revenue ÷ Visitors
Example Calculation:
If your website generated $10,000 in revenue from 5,000 visitors, your RPV would be:
$10,000 ÷ 5,000 = $2 per visitor
For Example:
If you're running a high-traffic blog and your RPV is low, you could focus on monetizing the site better by introducing affiliate links, paid subscriptions, or product recommendations to increase revenue per visitor.
13. Engagement Rate
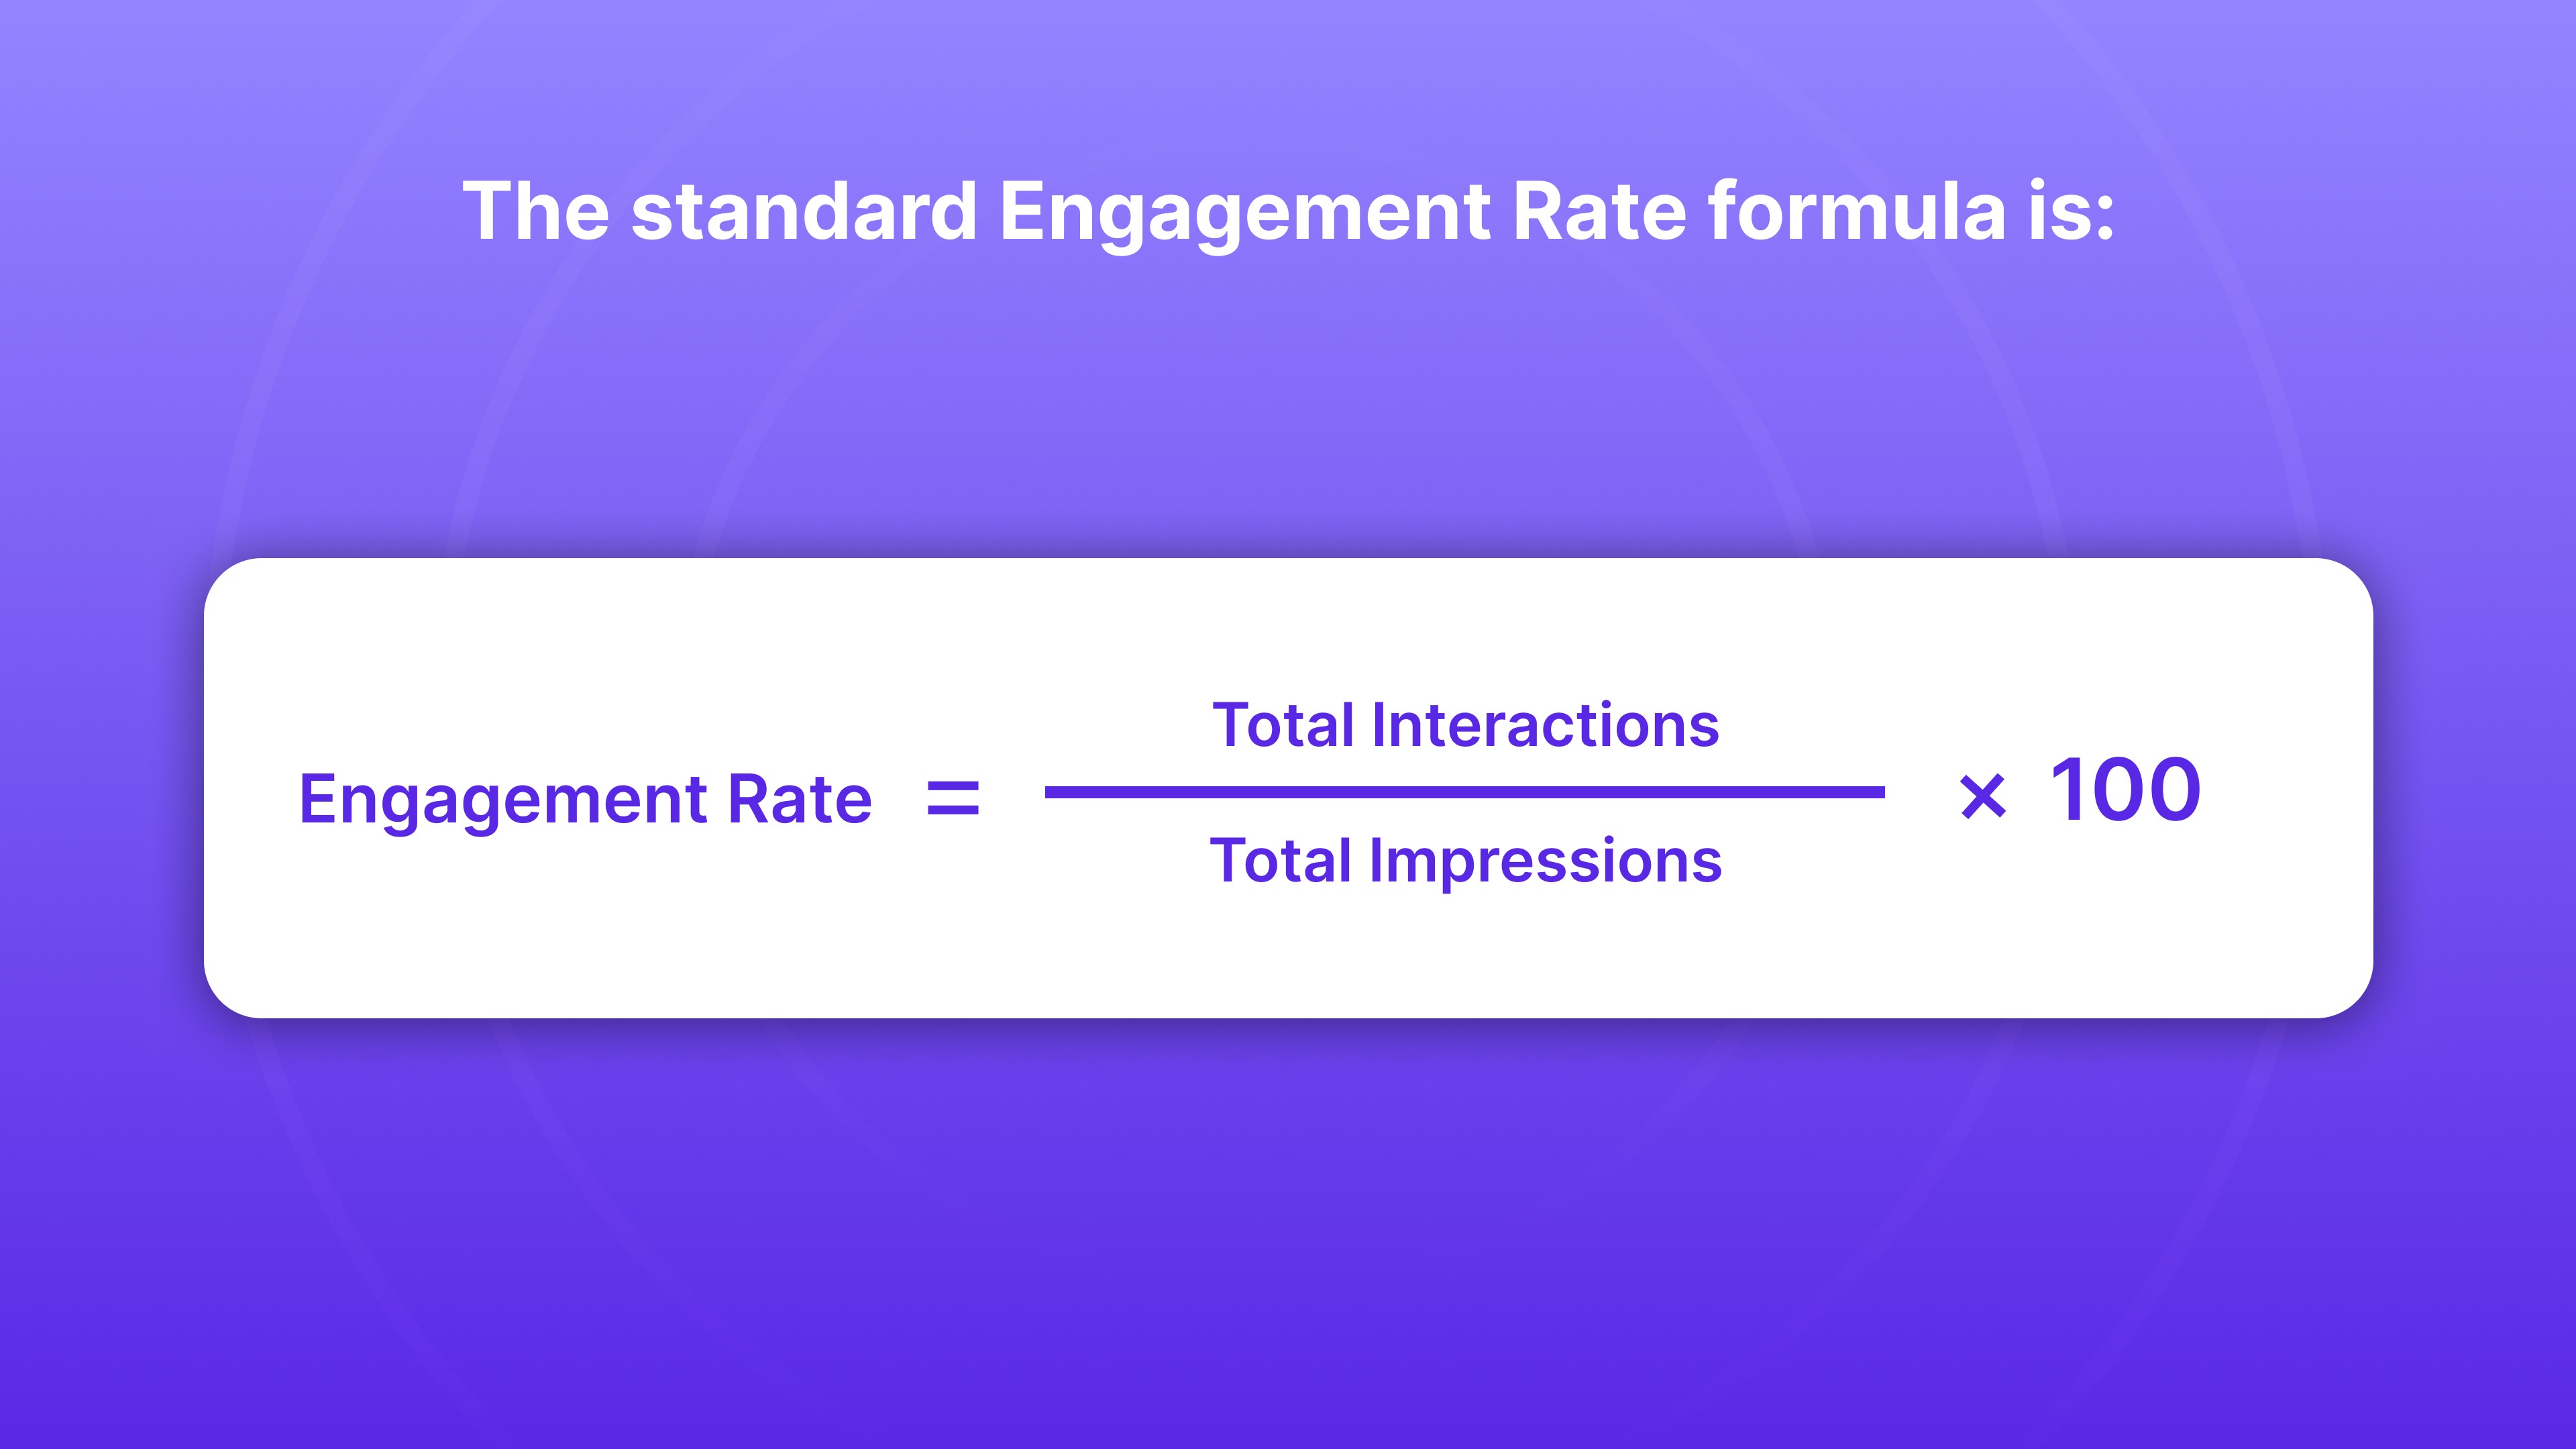
Engagement rate measures how much users interact with your content on your site or social media channels. High engagement means users find your content interesting and are more likely to take further actions, such as making a purchase or sharing your content. It's a strong indicator of content relevance and user interest.
Formula:
Engagement Rate = (Total Interactions ÷ Total Impressions) × 100
Example Calculation:
If your post received 500 likes, 100 comments, and 200 shares with 10,000 views, your engagement rate would be:
(500 + 100 + 200 ÷ 10,000) × 100 = 8%
Nudge personalizes content based on user behavior, ensuring visitors see the most relevant information. This personalized approach increases engagement and drives higher conversions.

14. Heatmaps and Scroll Depth
Heatmaps and scroll depth are valuable metrics for understanding how visitors interact with your website. Heatmaps show where users click most frequently, while scroll depth tracks how far down a page they scroll.
Together, they provide insight into which areas of your page attract attention and where engagement drops off, allowing you to optimize your content layout.
Formula:
Heatmap and Scroll Depth don't have a specific formula but are tracked through behavior analytics tools.
Example:
If heatmaps show that most users are clicking on a CTA button buried below the fold, it may be time to move it higher on the page.
Similarly, if the scroll depth data reveals that users aren't scrolling past the first 50% of the page, you might need to rework the content placement to keep them engaged.
15. Exit Rate
Exit rate measures the percentage of visitors who leave your website after viewing a specific page. Unlike bounce rate, which tracks single-page visits, exit rate focuses on where visitors exit your site after viewing multiple pages. It helps identify pages where users lose interest or encounter friction before completing a desired action.
Formula:
Exit Rate = (Exits ÷ Total Page Views) × 100
Example Calculation:
If a page has 1,000 views and 200 exits, the exit rate would be:
(200 ÷ 1,000) × 100 = 20%
For Example:
For an eCommerce site, if many users are exiting after viewing the cart page, it may signal issues with the checkout process. Simplifying the checkout or adding trust signals can help reduce exit rates and improve conversions.
With these metrics, you now have the tools to identify areas for improvement in your CRO strategy. To optimize these efforts even further, Nudge offers real-time, personalized experiences that drive higher engagement and conversions.
How Nudge Can Help Optimize Your CRO Strategy?
Nudge's commerce surfaces are designed to improve every stage of the customer journey with real-time personalization. By adapting content based on shopper behavior, Nudge drives higher engagement and conversions without requiring development resources.
With its powerful features, Nudge allows marketers to optimize their websites and boost CRO with ease.
Key Features and Benefits:
Real-Time Personalization Across the Funnel: Customizes homepages, landing pages, PDPs, PLPs, carts, and checkout based on shopper intent, campaign source, and behavior, ensuring a personalized experience throughout the user journey.
AI Product Recommendations: Context-aware product suggestions and smart bundles across PDPs, carts, and exit-intent flows, always in sync with inventory and shopper behavior to drive conversions.
Contextual Nudges: Dynamic banners, modals, and pop-ups triggered by scroll depth, exit intent, referrer, or time-on-page, increasing engagement and conversion rates.
Cart Abandonment Recovery: Triggers personalized nudges or offers to win back shoppers who abandon their cart, effectively reducing abandonment and improving conversion and retention.
Higher CVR, AOV, LTV & Lower CAC: Personalization increases engagement, reduces drop-offs, encourages repeat purchases, and improves overall customer lifetime value.
Continuous Learning: Nudge's AI continuously learns from user interactions to keep experiences relevant and evolving, driving long-term optimization.

Wrapping Up
Tracking the right metrics to help you analyze conversion rate optimization is key to improving your website's performance. From conversion rate and CTR to customer acquisition cost and cart abandonment, each metric reveals valuable insights to refine your strategy.
Monitoring these metrics regularly allows you to optimize your CRO efforts and drive better results.
Nudge improves your CRO strategy by delivering real-time, personalized experiences personalized to each visitor's behavior. Its AI-driven platform helps optimize every stage of the customer journey, improving engagement and increasing conversions.
Book a demo with Nudge today and start transforming your CRO strategy.
FAQs
Q. How can I improve my Conversion Rate Optimization (CRO) strategy?
A. To improve CRO, track key metrics like conversion rate, bounce rate, and AOV. Focus on optimizing landing pages, simplifying the checkout process, and personalizing content to enhance user engagement.
Q. What is a good Click-Through Rate (CTR) for ads?
A. A good CTR depends on the industry, but a CTR between 2-5% is considered average for most eCommerce campaigns. Higher CTRs often indicate well-targeted ads and compelling CTAs.
Q. How can I reduce my website's bounce rate?
A. To reduce bounce rates, improve page load times, make content more relevant, and ensure your landing pages are engaging. Focus on delivering a seamless and user-friendly experience to keep visitors engaged.
Q. Why is Average Order Value (AOV) important for my business?
A. A higher AOV means you're generating more revenue per customer without increasing traffic. Increasing AOV through upselling and cross-selling strategies is an effective way to increase overall sales.
Q. How does Nudge help improve Conversion Rate Optimization (CRO)?
A. Nudge personalizes the user experience in real-time by adapting content based on visitor behavior. Its AI-driven platform optimizes every stage of the customer journey, increasing engagement and conversions.