CRO & Experimentation
How to Optimize Your Conversion Funnel Analysis for Revenue Growth
Boost your results with conversion funnel analysis. Map customer journeys, track touchpoints, and optimize to reduce drop-offs. Click to enhance!

Gaurav Rawat


Many e-commerce visitors leave before completing purchases, leaving brands with missed revenue opportunities. Even in 2025, the global average conversion rate is only 2-4%, and top-performing sites still struggle with cart abandonment rates as high as 70.22%.
Analyzing your conversion funnel can reveal exactly where users drop off, helping marketers and eCommerce teams optimize product pages, landing pages, and checkout flows to create smoother, more engaging experiences.
By combining behavioral data with funnel insights, brands can make targeted improvements such as personalized product recommendations, optimized CTAs, and streamlined checkout steps that increase conversions and encourage repeat purchases.
Ready to see how conversion funnel analysis can improve your website performance? Let’s get started!
Key Takeaways
Conversion funnel analysis reveals where shoppers drop off, helping brands understand hesitation points and optimize the journey from browsing to checkout.
Real-time insights allow customers like BigBasket & L'oreal to reduce friction, fix checkout issues, and increase completed orders.
Personalized experiences, such as tailored recommendations and contextual nudges, guide users toward purchase while keeping them engaged.
Tracking metrics like stage-wise conversion, micro-actions, and cart abandonment highlights opportunities to refine each step of the funnel.
Continuous analysis and iterative improvements ensure the funnel adapts to changing shopper behavior, driving consistent growth and higher conversions.
If you want to improve your website performance, the first step is understanding the foundation.
What is a Conversion Funnel?
An ecommerce conversion funnel is a visual representation of the steps a visitor takes from the moment they land on your site to completing a desired action, usually a purchase. It acts as a roadmap showing how users interact with your brand across each touchpoint.
To better understand how visitors move through your site, you can break the journey into key stages:
Landing Page / Top of the Funnel: Visitors explore your site. They might see your homepage, browse product listings, or check out special offers.
Product Detail Pages (PDPs): Visitors view specific products, read descriptions, check images, and evaluate options.
Add to Cart: Visitors select products and add them to their shopping cart.
Checkout: Visitors enter payment and shipping details to complete their purchase.
At every stage of the funnel, some visitors drop off, often due to pricing doubts, delivery issues, or limited product options. For e-commerce grocery brands, these gaps reveal exactly where shoppers lose confidence.
For instance, BigBasket noticed higher drop-offs during checkout when delivery slots were unavailable. By introducing flexible time slots and “Express Delivery,” it reduced friction and increased completed orders.
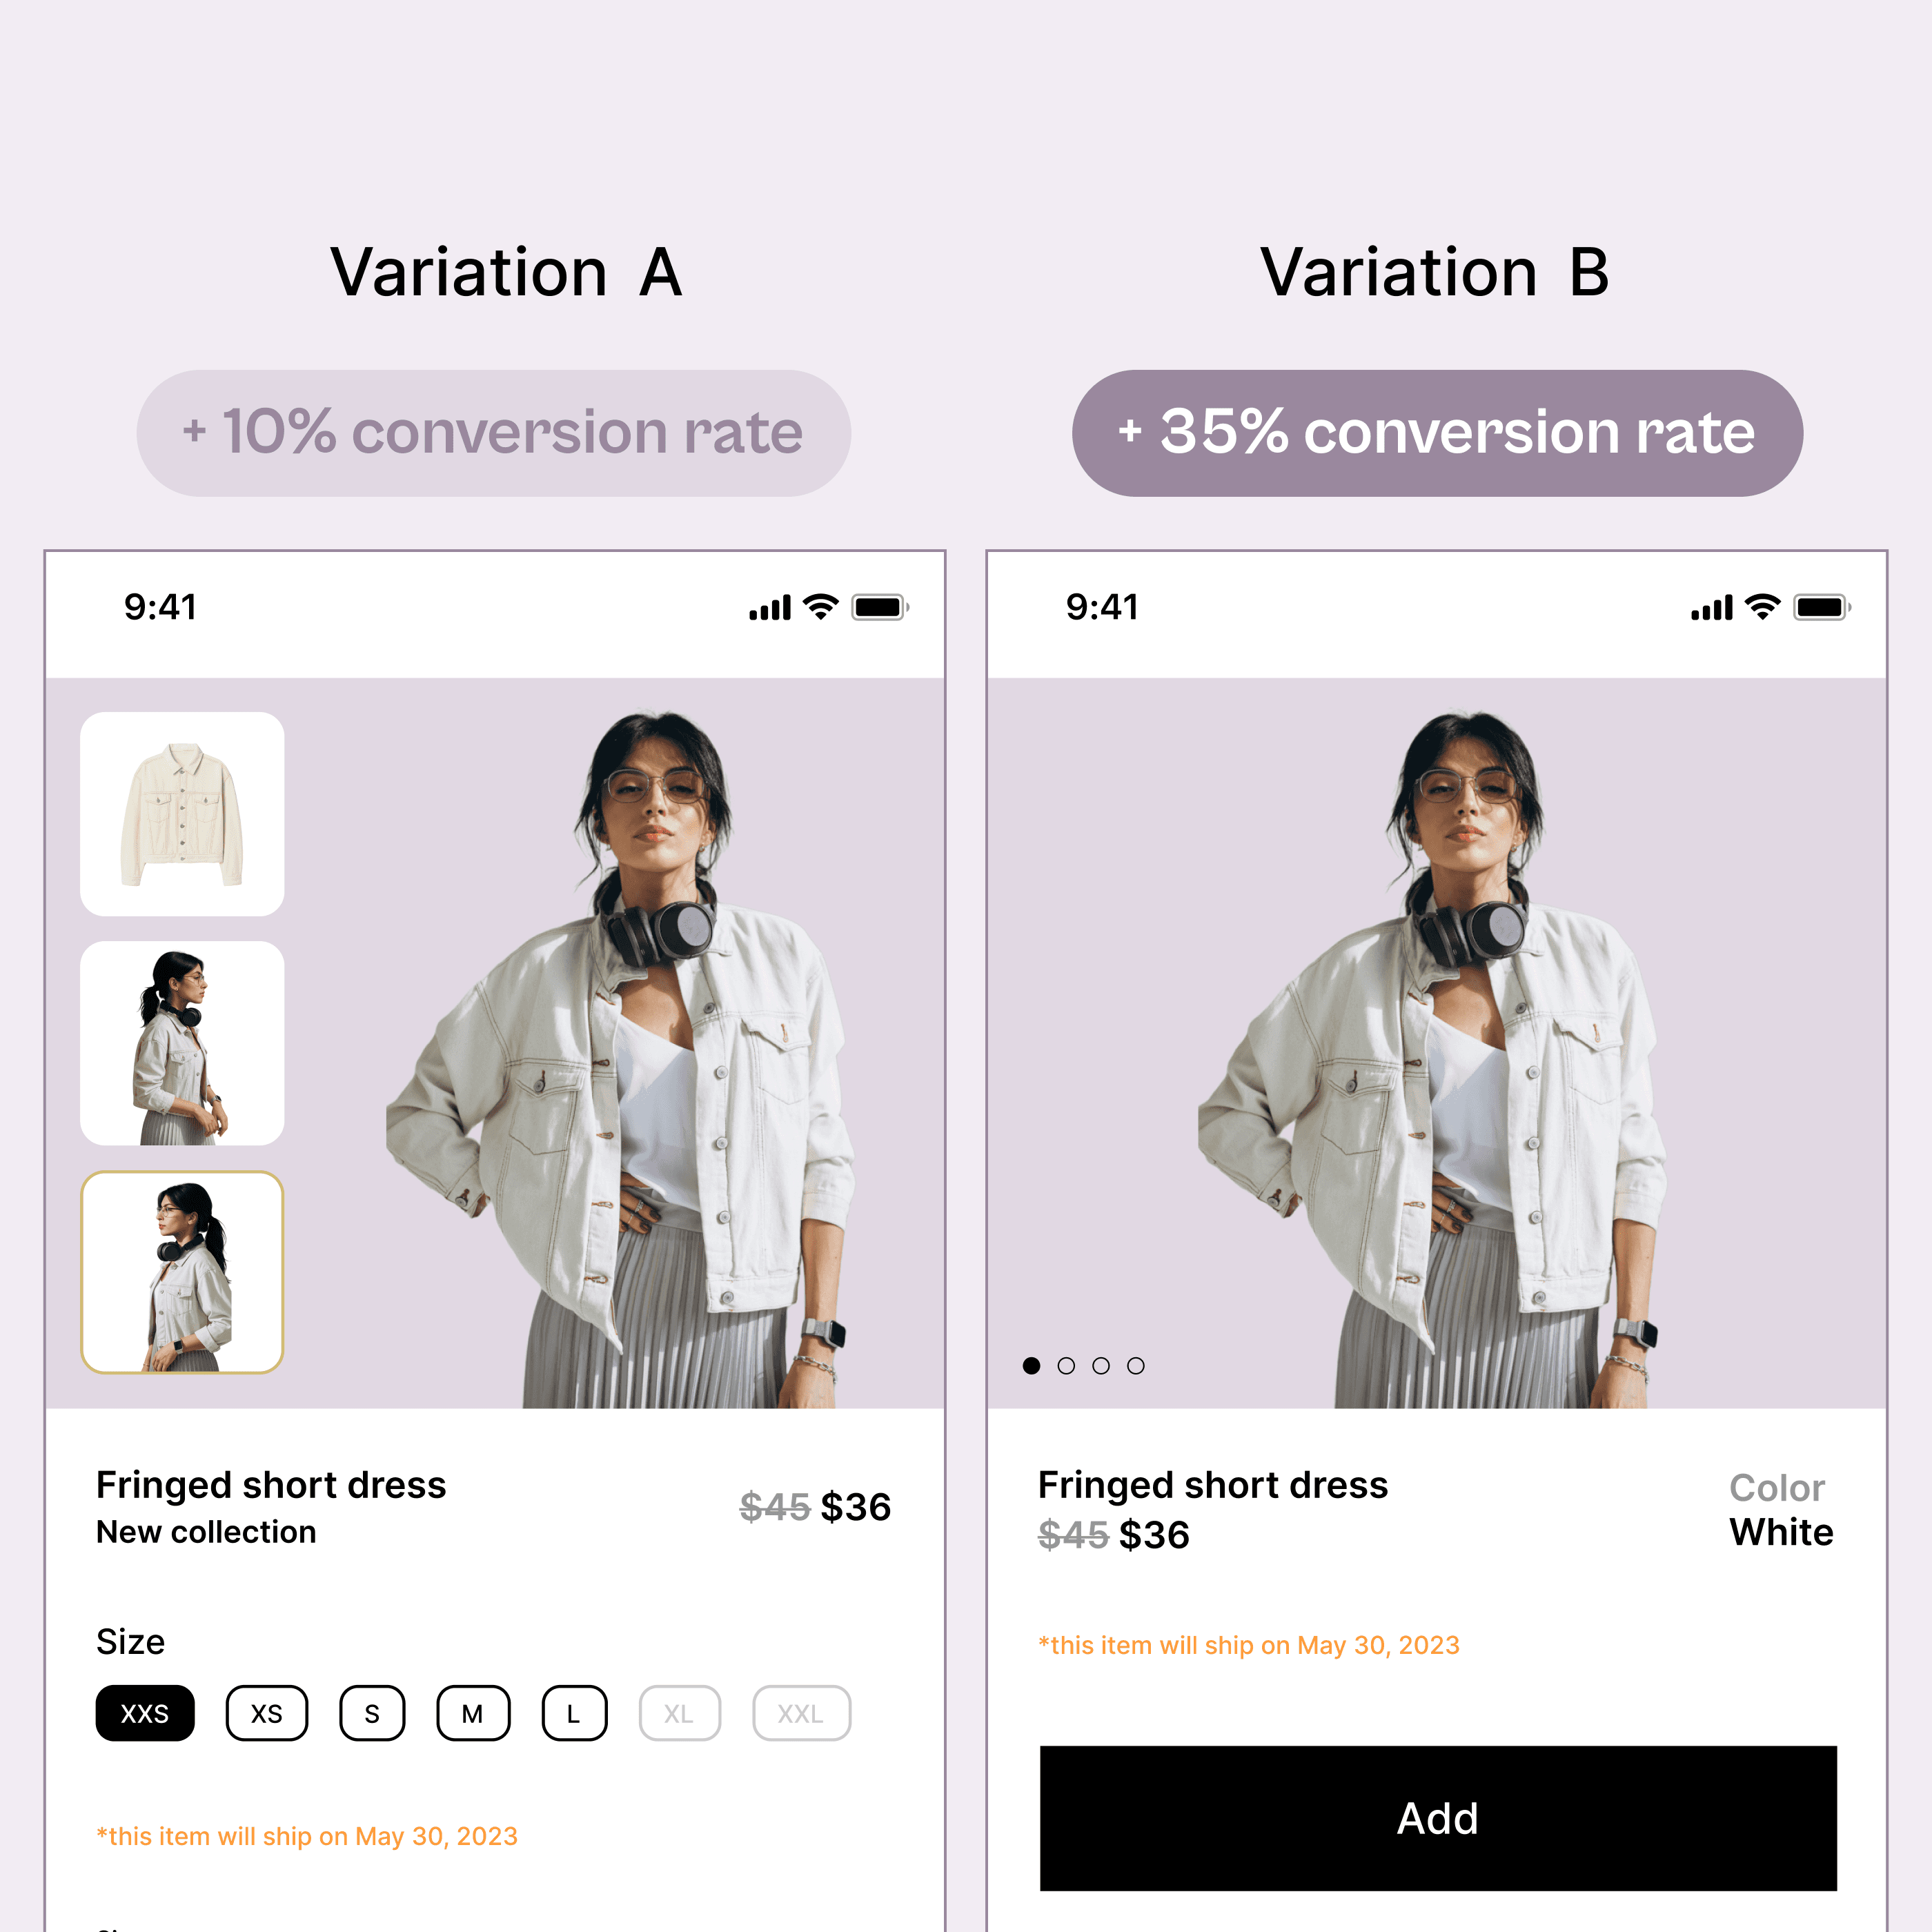
A clear conversion funnel not only helps you track user progress but also guides personalization strategies to make the buying process smoother and increase conversions.
Use Nudge to gain real-time insights into your conversion funnel and create a smoother shopping journey at every stage. Track visitor behavior, identify drop-offs, and deliver personalized recommendations and targeted nudges to guide shoppers toward completing their purchases.

Also Read: Maximizing E-commerce Conversions with Large-Scale Behavioral Targeting
In e-commerce, each funnel serves a clear purpose. The conversion funnel drives specific actions like purchases, the sales funnel guides visitors from awareness to buying, and the marketing funnel attracts and nurtures audiences to build loyalty.
Focusing on the right funnel at each stage helps turn visitors into loyal customers efficiently.
Once you understand what a conversion funnel is, the next step is to see why analyzing it is critical for success.
Why Conversion Funnel Analysis is Crucial for E-Commerce Success?
Analyzing your conversion funnel is more than just measuring clicks and sales, it’s about spoting actionable insights to improve your website performance and revenue.
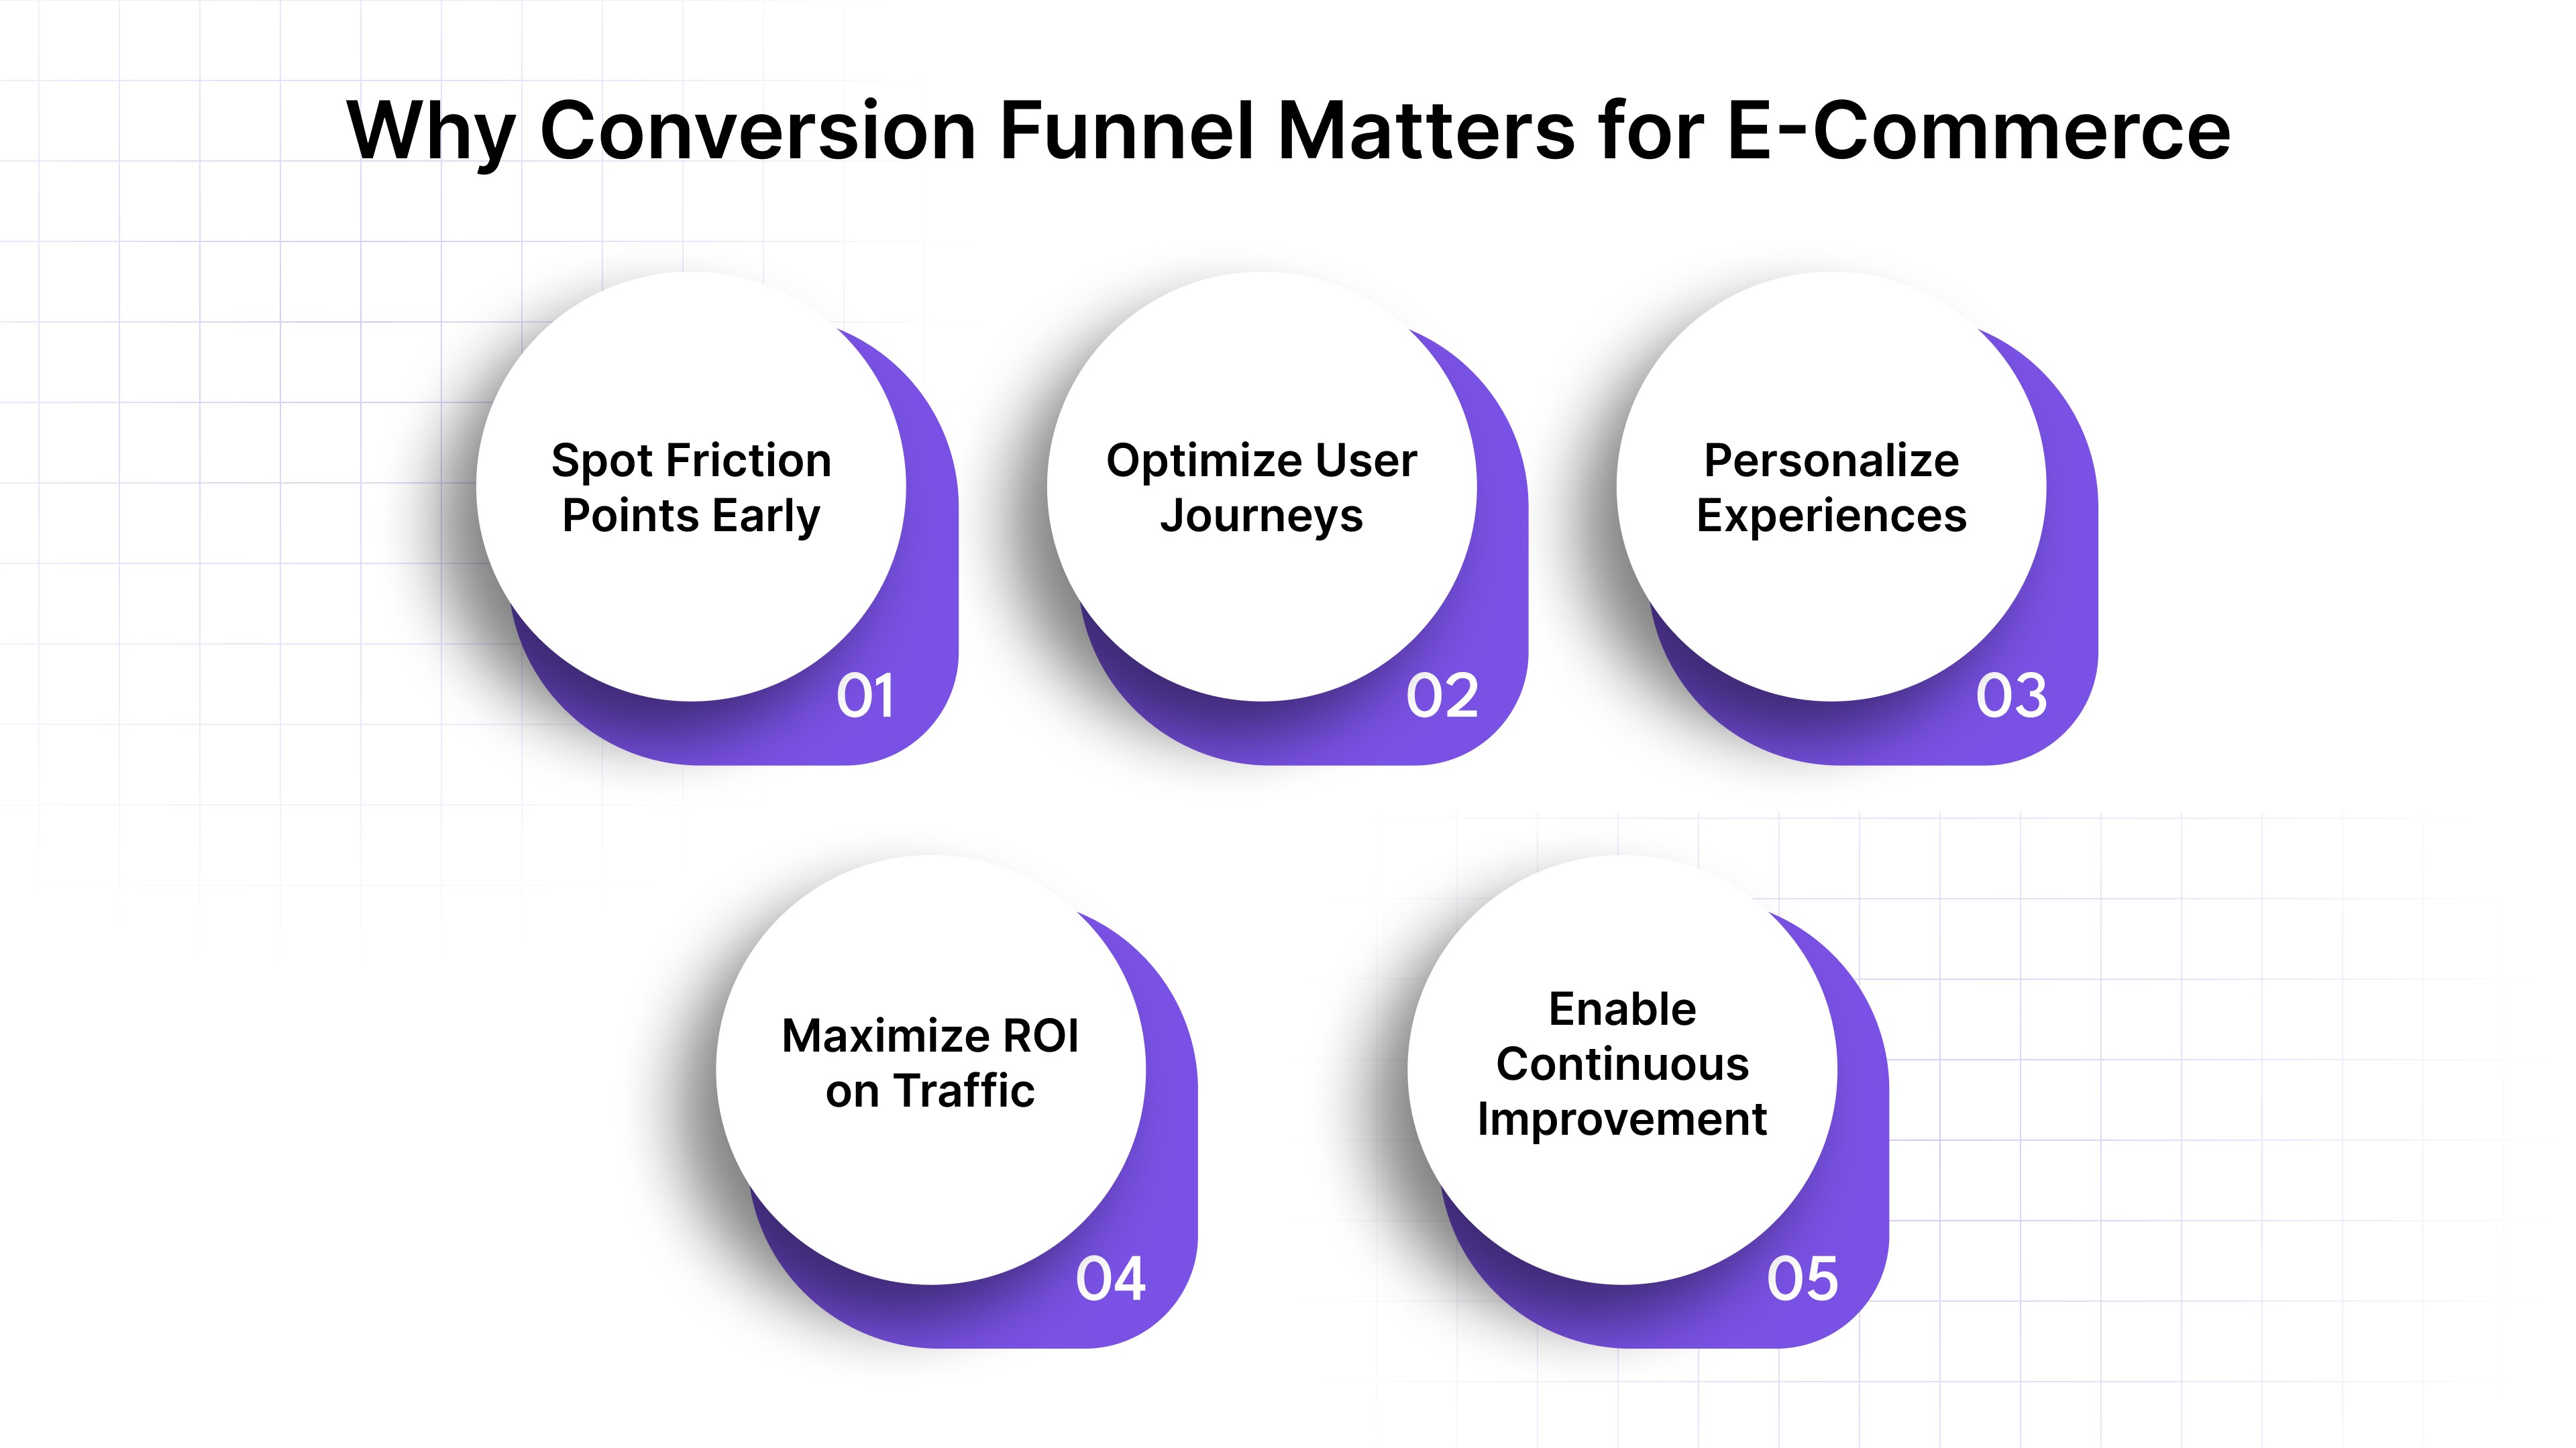
Here’s why it matters for e-commerce and DTC brands:
Spot Friction Points Early: Funnel analysis reveals exactly where users drop off, whether it’s on the product listing page, PDP, or checkout. Fixing these areas prevents lost sales.
Optimize User Journeys: By understanding which steps slow down conversions, you can make targeted improvements like simplifying forms, adjusting CTAs, or highlighting best-sellers.
Personalize Experiences: When combined with real-time personalization tools, funnel analysis allows brands to deliver tailored recommendations, banners, and nudges that match user intent, increasing engagement and conversions.
Maximize ROI on Traffic: Paid campaigns are only as effective as the conversion they generate. Funnel analysis ensures your marketing spend converts into actual sales rather than wasted clicks.
Enable Continuous Improvement: Funnels are dynamic. By regularly reviewing performance, you can iterate and refine your site, keeping pace with evolving customer behavior and expectations.
So, conversion funnel analysis transforms raw traffic data into actionable insights, giving you the clarity to convert casual visitors into loyal buyers.
With Nudge, you can turn conversion funnel insights into action. Send real-time, behavior-based messages like personalized offers, urgency alerts, and seasonal promotions to visitors at key points in their journey. This keeps users engaged, minimizes drop-offs, and encourages more purchases at every stage of your funnel.

With these benefits in mind, the next step is to understand how to actually analyze your conversion funnel effectively.
How to Analyze Your Conversion Funnel for Better Results?
For ecommerce and DTC brands investing heavily in paid traffic, understanding what happens after a shopper lands on your site is critical. A well-structured conversion funnel shows how visitors progress through each stage, where they hesitate, and which interactions influence their decisions.
When paired with real-time personalization, funnel analysis transforms from a static exercise into a dynamic strategy. It gives marketers the agility to adjust PDPs, PLPs, carts, and checkout pages in real time, ensuring every session feels relevant and drives measurable growth.
Here’s a structured approach to conducting a conversion funnel analysis with practical examples, tips, and tools to help you find better results.
1. Define the Customer Journey and Map Out Touchpoints
Before moving into data, it’s important to clarify how shoppers actually interact with your brand across different entry points and devices. A precise journey map gives you visibility into every interaction and sets the foundation for accurate funnel analysis:
List all critical stages from first click to purchase confirmation, including detours like search bars, offer modals, or recommendation blocks.
Mark cross-device paths, for instance, a shopper browsing on mobile and later purchasing via desktop.
Identify off-site entry points (e.g., TikTok landing pages, Instagram product tags, influencer swipe-ups) that bypass traditional homepage flows.
Example: Nykaa noticed users arriving from Instagram ads often skipped the homepage and went directly to product pages. They added “Shop the Look” sections on PDPs tailored to ad campaigns, improving engagement and add-to-cart rates.
Tip: Visualize this map on a single board. The clearer the structure, the easier it becomes to detect where friction naturally builds up.
2. Set Up Conversion Events and Track the Customer Experience
Once the journey is mapped, your next focus should be defining what success looks like at each stage. Precise conversion event tracking provides the measurable checkpoints you need to diagnose performance issues with confidence:
Tag both primary and micro-conversions, such as CTA clicks, shipping info views, or time spent on PDP modules.
Track cross-channel and device performance to uncover gaps between mobile and desktop behavior.
Group events by campaign source to see which acquisition efforts align best with downstream funnel progress.
Example: Licious added tracking for repeat product views, enabling personalized reminders and recommendations, lifting conversions on returning visitors.
Tip: Don’t limit your tracking to default analytics. Layer on behavioral psychology signals like idle time or scroll thresholds for richer, real-time insights.
3. Identify Drop-off Points in the Funnel
Identifying where shoppers disengage helps you uncover the exact stages that need intervention. Instead of focusing only on end-of-funnel abandonment, analyze how users behave at every step.
Use step-by-step comparison to isolate transitions with the steepest decline (e.g., PLP → PDP or Cart → Checkout).
Break down drop-offs by campaign source and device to detect localized friction patterns.
Focus on early-stage exits too, these often offer higher ROI opportunities than chasing abandoned carts alone.
Example: Ocado noticed higher drop-offs on product listing pages due to slow mobile load. Optimizing speed lifted conversions before checkout..
Tip: Segment drop-off analysis by new vs. returning visitors. Different cohorts often fail at different stages, and personalized fixes yield faster results.
4. Use Tools to Gather Deeper Insights
While funnel numbers pinpoint where users drop, behavioral tools reveal why they behave that way. Pairing analytics with interaction-focused tools gives you a complete picture:
Deploy heatmaps to spot underperforming CTAs or sections that receive minimal attention.
Review session recordings to understand hesitation patterns, like repeated scrolling or toggling between tabs.
Run focused A/B tests on high-impact changes instead of lengthy, broad experiments.
Use form analytics to detect abandonment caused by confusing or lengthy checkout fields.
Example: Sephora saw users lingering on ingredient sections without scrolling further. Reordering PDP content to feature reviews and “Add to Cart” above improved conversions
Tip: When analytics data looks inconclusive, qualitative behavior clues often explain sudden shifts better than raw numbers.
Nudge’s Commerce Surfaces helps improve every step of your conversion funnel by showing users content and products that match what they are looking for. Using real-time insights, you can change recommendations, product displays, and messages so visitors stay engaged and complete their purchases.

5. Segment Customers Based on Conversion Points
Not every visitor responds to the same tactics. Segmentation by funnel stage enables tailored experiences that address each group’s unique friction points.
Create segments for browsers, high-intent PDP viewers, cart abandoners, and checkout initiators.
Layer behavioral qualifiers like time on page, number of products viewed, or click depth to refine these segments.
Trigger contextual experiences for each segment without relying on engineering support.
Example: Amazon segmented new vs. returning shoppers, offering timely recommendations and personalized discounts, increasing repeat conversions.
Tip: Start with the highest-intent, highest-drop-off segment first. Improvements here deliver measurable revenue gains quickly.
Also Read: Audience Segmentation Models: Types and Examples
6. Visualize and Analyze Funnel Data
Good visualization converts raw numbers into clear, actionable stories. Instead of scanning endless spreadsheets, structured visual funnels make performance patterns obvious at a glance:
Build funnel charts that display conversion and abandonment rates at every step, broken down by relevant filters like device or traffic source.
Layer in location or campaign attributes to spot regional issues or source-specific friction.
Combine real-time interaction data with analytics platforms for dynamic dashboards rather than static reports.
Example: ASUS combined traffic source and device data to optimize mobile checkout during high-traffic campaigns.
Tip: Schedule weekly funnel reviews. Trends shift quickly during campaigns, and timely detection saves revenue.
7. Optimize the Funnel Continuously
Funnel analysis is only valuable if it leads to ongoing, rapid optimization. Instead of waiting for quarterly redesigns, act on insights in real time to keep pace with shopper behavior:
Rank opportunities by impact × urgency to focus efforts where they matter most.
Roll out incremental UI updates such as repositioning CTAs or highlighting top bundles to test improvements quickly.
Launch changes instantly across PDPs, PLPs, carts, and checkouts without engineering delays.
Revisit your funnel after each major campaign to catch emerging friction early.
Example: Zalando continuously tweaks PDP layouts, recommendations, and cart nudges based on real-time behavioral data to improve conversion rates.
Tip: Treat funnel optimization like campaign management, iterative, fast-moving, and data-driven. The quicker your response, the stronger your compounding results.
Once you have optimized your funnel analysis process, the next focus is on tracking the right performance indicators.
Key Metrics to Track in Your Conversion Funnel
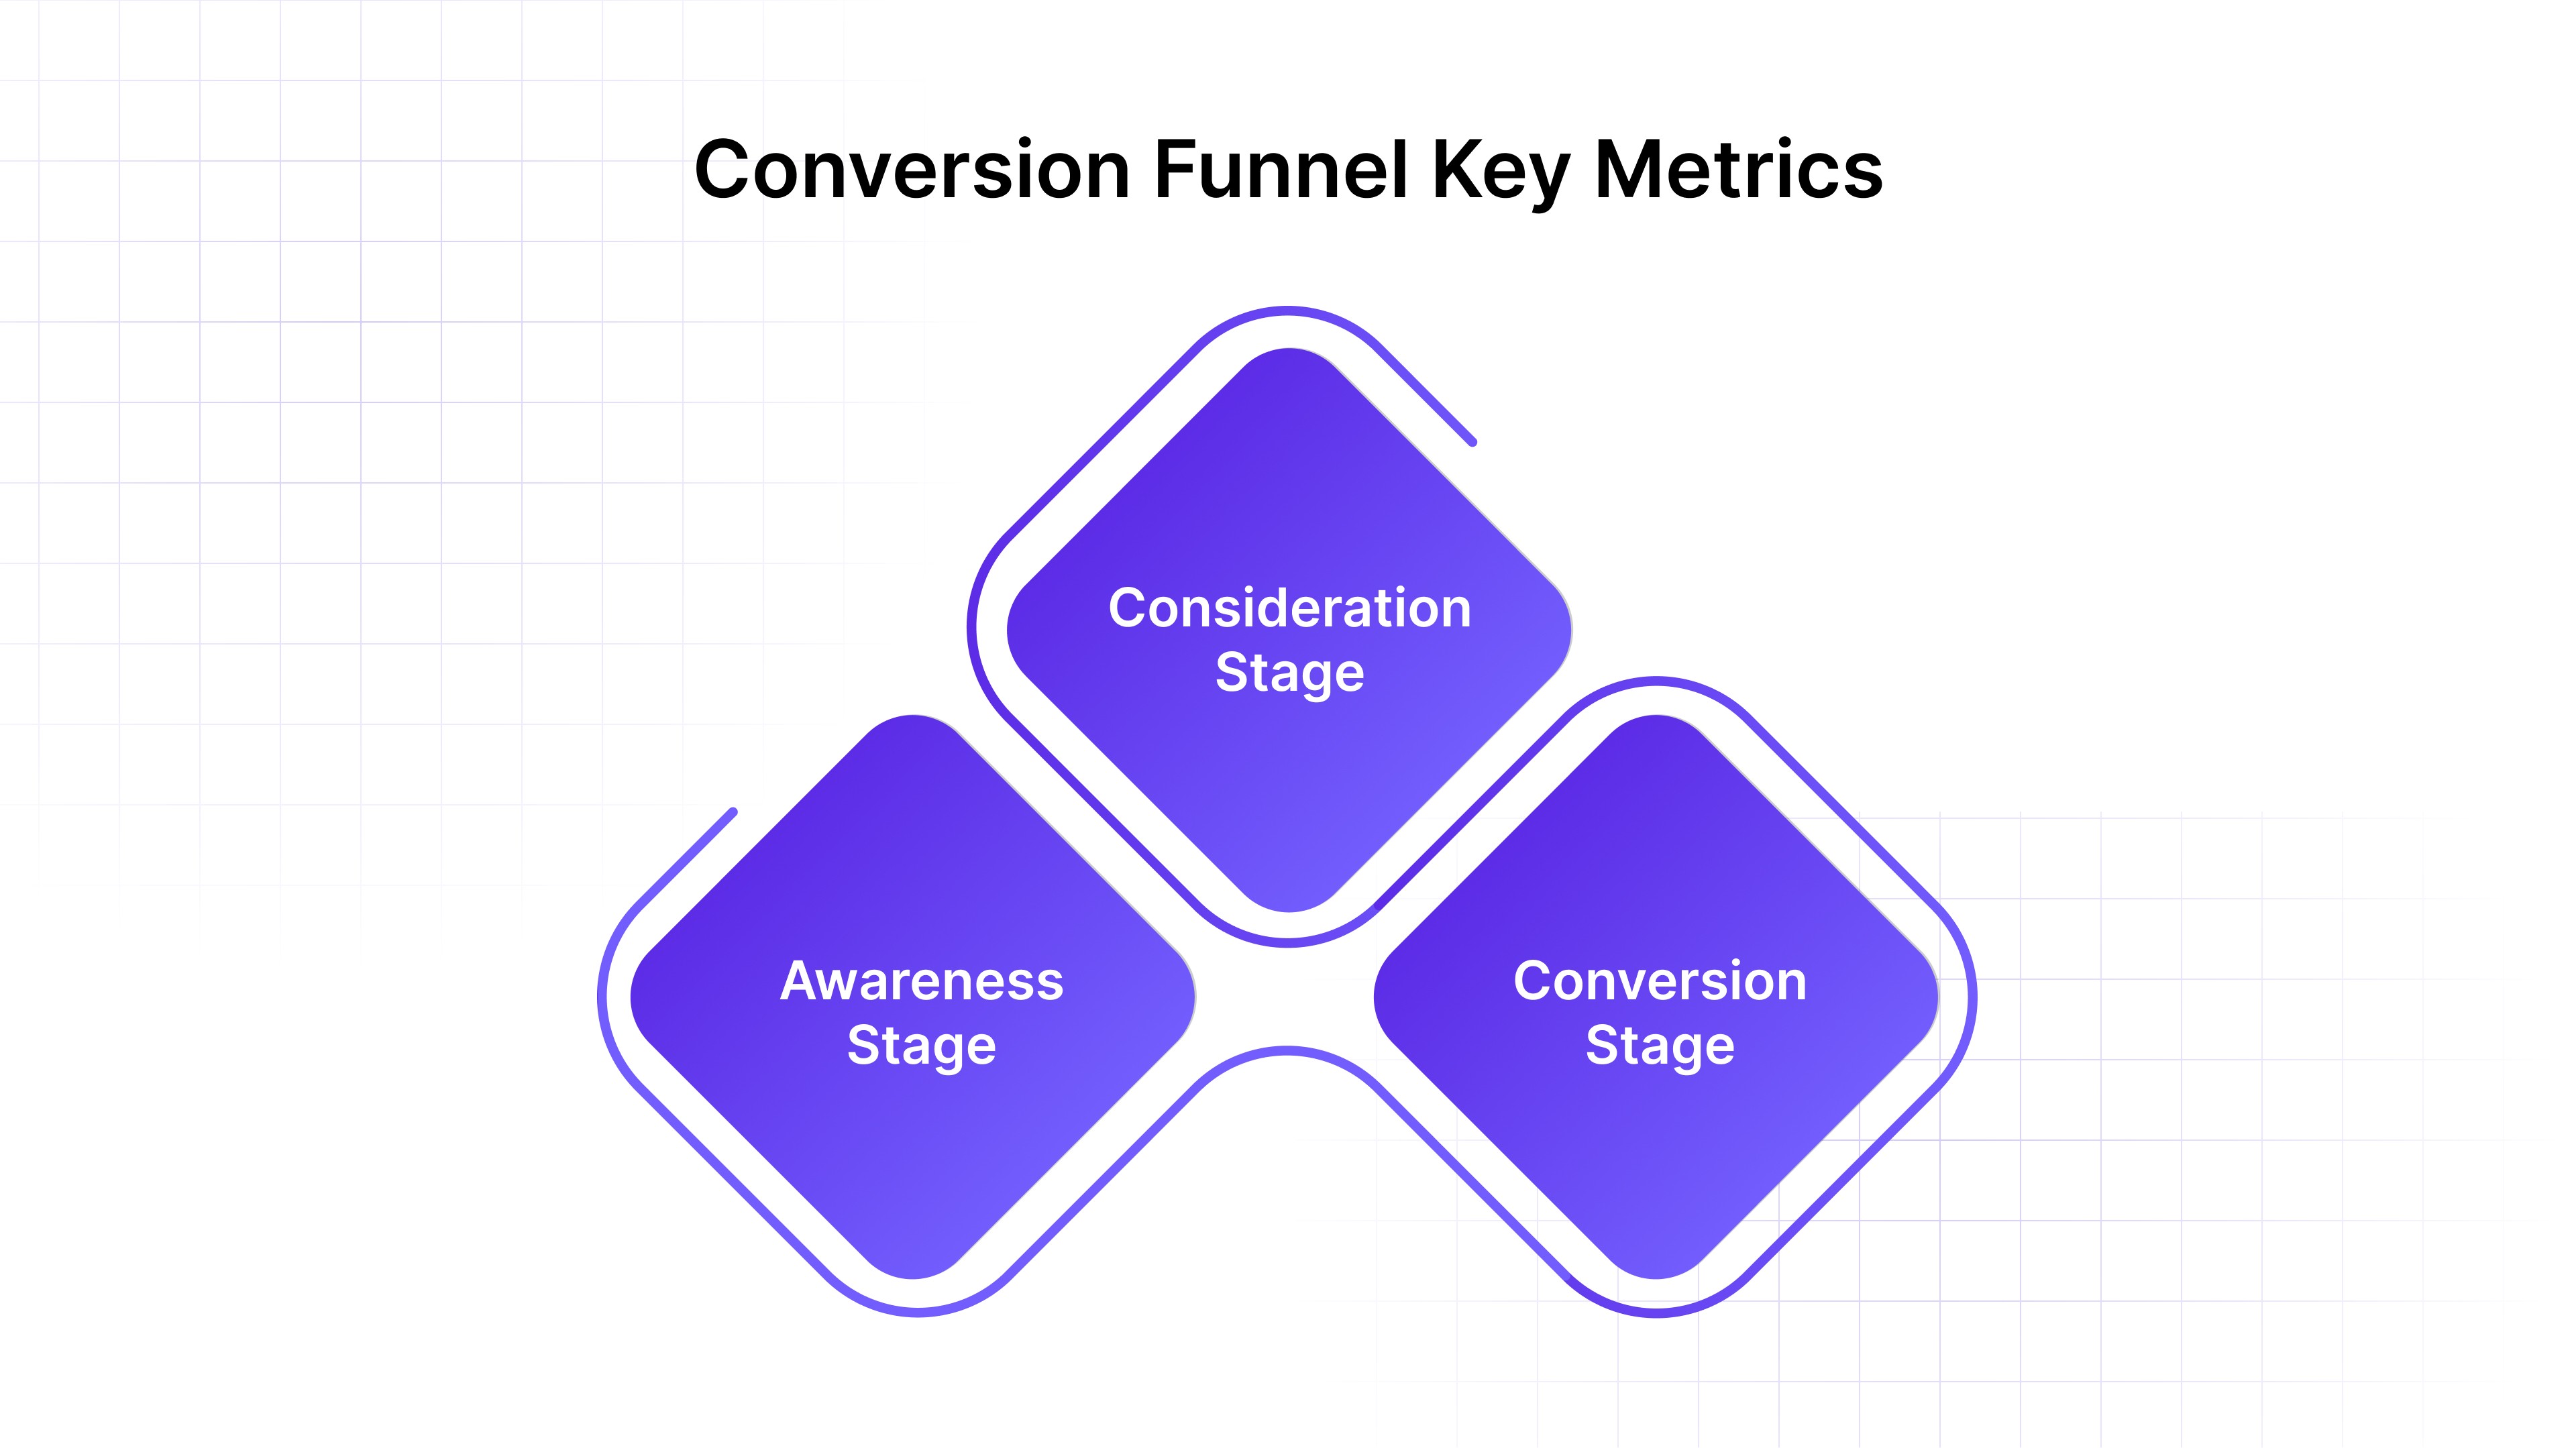
To make your funnel analysis meaningful, track metrics that reveal both performance and friction at each stage of the funnel:
1. Awareness Stage (Landing pages, traffic acquisition)
Traffic Source Performance: Understand which channels (organic, paid, social, influencer) drive the most engaged visitors.
Average Session Duration: Short sessions may indicate poor content relevance or confusing navigation.
Bounce Rate: Percentage of users leaving immediately; high rates suggest landing pages need optimization.
2. Consideration Stage (Product listing pages, PDPs, browsing)
Conversion Rate by Stage: Measure how many users move from PLP → PDP → Add to Cart. Low rates indicate friction in product discovery or evaluation.
Micro-Conversions: Actions like clicking on recommendations, selecting variants, or viewing multiple products indicate engagement and interest.
Drop-Off Rate: Track where users stop exploring products to pinpoint friction points.
3. Conversion Stage (Cart and Checkout)
Cart Abandonment Rate: Tracks users who add items but do not complete purchases; helps optimize checkout flow and messaging.
Time to Conversion: Measures how long it takes users to complete a purchase; long durations can indicate hesitation or complexity.
Device and Location Metrics: Identify mobile-specific or regional issues that affect completed purchases.
Tracking these metrics gives a clear picture of both how your visitors move through your site and why they might abandon a step. Combining these insights with Nudge’s AI-powered personalization tools ensures each visitor experiences a journey designed to convert.
Also Read: Top 10 eCommerce Product Page Examples in 2025
Once you know what to track, the next step is to use tools that make your analysis actionable and effective.
Maximize Your Conversion Funnel Analysis with Nudge’s AI Tools
When visitors land on your site, every click and scroll matters. Conversion funnel analysis helps you track how users move through each stage from landing pages to checkout, so you can spot where they drop off and what drives purchases.
For high-growth e-commerce and DTC brands in fashion, beauty, retail, and grocery, Nudge’s AI tools help marketing teams optimize funnels, test changes instantly, and deliver personalized experiences without relying on engineering support.
To make your analysis actionable, here are the key ways Nudge can help improve each stage of your funnel:
Commerce Surfaces: Personalize every stage, from landing pages to carts. Use dynamic product grids, banners, and content blocks to see which elements drive engagement and conversions.
AI Product Recommendations: Show personalized product suggestions across PDPs, carts, and checkout pages. Track which items encourage purchases and increase average order value.
Contextual Nudges: Deliver targeted popups, banners, or messages based on actions like scrolling, exit intent, or time on page. Reduce drop-offs and guide users toward completing key funnel steps.
1-1 Personalization: Tailor offers, content, and recommendations to individual users. This makes each stage of your funnel more relevant, improving engagement and conversions.
Funnel Personalization: Monitor how users progress, identify drop-off points, and prioritize changes that drive measurable improvements.
Cart Abandonment Recovery: Re-engage visitors who leave mid-purchase with personalized offers or reminders. Recovering carts is critical for improving checkout conversions.
Omnichannel Compatibility: Ensure your funnel performs seamlessly across mobile, desktop, and other platforms, maintaining consistent experiences wherever users engage with your brand.
Whether you are analyzing traffic, testing page layouts, or recovering abandoned carts, Nudge makes conversion funnel analysis actionable and results-driven.

Conclusion
Conversion funnel analysis is a key strategy for any e-commerce or DTC brand that wants to improve website performance and increase conversions. Remember, conversion funnel analysis is an ongoing process.
Regular review and refinement help you identify drop-offs, optimize user journeys, and improve overall results. The more you analyze your funnel, the clearer the opportunities to improve each stage of the customer journey.
With Nudge’s AI-powered tools, you can simplify conversion funnel analysis, track user behavior in real time, test changes quickly, and optimize your website for higher conversions without relying on developers.
Book a demo today and start turning more visitors into loyal customers!
FAQs
1. What is conversion funnel analysis and why is it important?
Conversion funnel analysis tracks how visitors move through your website or app, from landing pages to checkout. It helps identify where users drop off so you can improve conversions, increase sales, and create smoother shopping experiences.
2. Which stages should I include in a conversion funnel analysis?
Include all key steps where visitors interact with your site, such as landing pages, product listing pages (PLPs), product detail pages (PDPs), carts, and checkout. You can also track smaller actions like clicking on recommendations or opening pop-ups.
3. How can conversion funnel analysis improve mobile conversions?
By analyzing the funnel separately for mobile users, you can spot mobile-specific issues like slow page load, difficult navigation, or checkout friction. Fixing these problems helps increase conversions from mobile traffic.
4. How often should I perform conversion funnel analysis?
Regularly. After launching campaigns, adding new products, or making site changes, analyze your funnel to catch drop-offs early and make improvements that improve conversions.
5. Can I use conversion funnel analysis to test different strategies?
Yes. Use the analysis to find pages or steps with high drop-offs, then run tests like A/B experiments on layouts, CTAs, or recommendations. This ensures your optimizations are data-driven and effective.